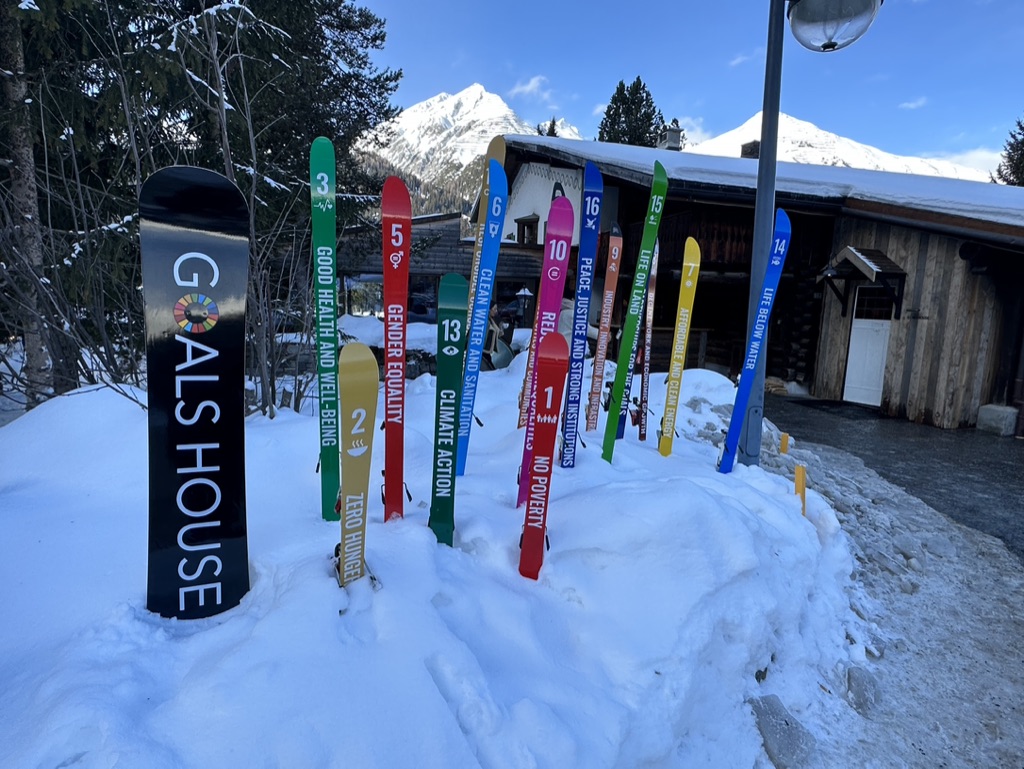
Together with the Club of Rome we built an AI powered Human Centred Extreme Weather Dashboard, launched in Goal’s House at ’23 World Economic Forum in Davos.
The 2022 Pakistan floods left the size of Switzerland under water and affected 33 million people. The intensification of cyclones saw some states lose 200% of their GDP in hours.
Opened by the Co-President of the Club of Rome the event was a launch of an AI enabled Human Centred Evidential System to increase awareness, build trust, enable targeted accountability at the granularity of local reporting with planetary scale; and a C level round table discussion on its implications.
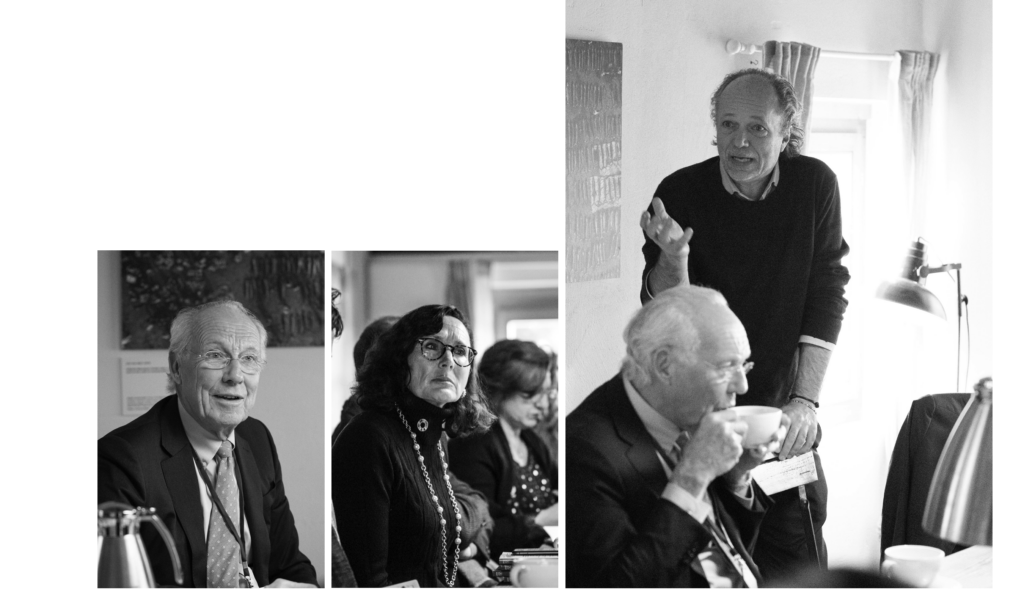
The dashboard launch was chaired by Co-President Club of Rome- Sandrine Dixson-Declève, co-Author of the Limits to Growth study Jorgen Randers and Chair of Finance for Biodiversity Simon Zadek and attended by members from the Insurance Industry, NGOs, Think Tanks, Advisory Firms, Climate Lawyers and Civil Society.
Why make a Human Centred Dashboard? We wanted to compliment the meteorological understanding of climate change with a human centred understanding of how Extreme Weather are impacting human activity systems. Where are people being impacted by extreme weather? This dashboard helps reveal where and how humans are being impacted by these extreme weather events.
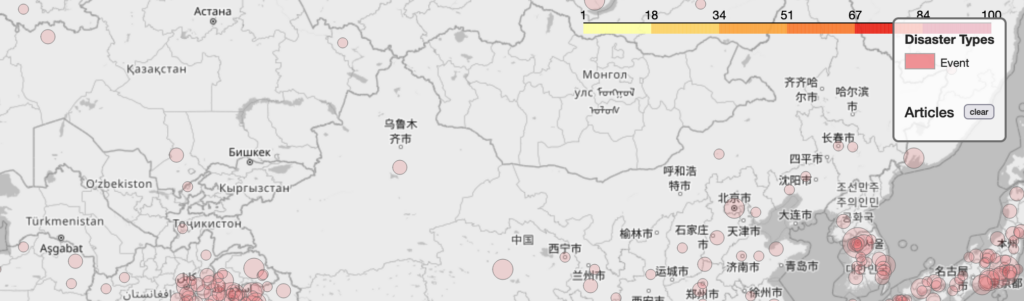
This system helps change the architecture of the conversation by proving the textual evidentiary support that can feed into the “Loss and Damage” discussion, help build trust in understanding events for financial institutions to build innovative products, the empower the donor community to target their support much more locally, etc. By having these planetary scale maps and we can build trust to see the momentum what is happening when and where, and use a breakthrough AI capability to be a platform for breakthrough climate action.
To build the dashboard we combined the following pipelines:
Global News View: 1/4 Billion URLs processed each day
Translation: Translating 15 languages for real better coverage
NLP-pipeline: Natural Language Processing at planetary scale: parsing, de-duplicatation, Named Entity Resolution, Classification
Location API: 1/4 M unique places in a knowledge graph with 1M+ alternative names
Human Timelines: Extract events within human timelines and human scale
AI Event Matching: Detects approx. 125K events per year evaluation based on certainty, severity, etc.
Explore the dashboard: